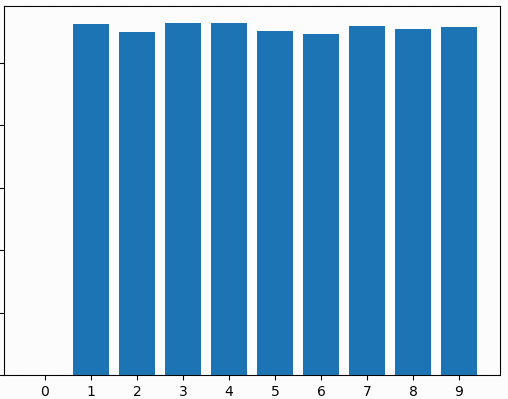
Q1: first histogram: random numbers
- Create a list of 100,000 numbers, each of them being a random integer between 1 and 999.
- You'll be looking only at the first digit of each of these numbers -- namely if the number is 681, then it's only the "6" that you're interested in.
- Count how many of the 100,000 numbers have a first digit of "1", how many of them have "2" as their first digit, etc. for all 9 digits If you divide these counts by 100,000 that will tell you the "1-fraction" and the "2-fraction", etc. -- namely the fraction of the numbers that start with "1" and the fraction that start with "2", etc.
- Think for a moment: do you expect the "7-fraction" to be larger than the "2-fraction"? Do you expect any of them to be larger than any other?
- Pause. Make your prediction.
- Now, after you've made your prediction create (and save) the histogram/barchart of these 9 fractions (use plt.bar())
- Create a suitable title and appropriate y-axis for it.
- Its shape should look something like this:
-

Q2: 2nd histogram: populations of US towns
- Download and get to know this dataset: population-of-towns.csv. There areabout 81,000 towns and their populations (as well as the states). Always try to understand what a dataset looks like, by looking at it in a text editor (that's what Python sees).
- Once more, count how many towns have a population whose population number has a "1" as its first digit, how many have "2" as their first digit, etc.
- Think for a moment: do you expect any significant difference between these 9 numbers?
- Now, after you've thought about it...
- Make your histogram/barchart, with title, etc.
- Huh?
Q3: 3rd histogram: video game sales
- Download historical sales data for popular video games from here:
- Take a look at your downloaded CSV file. There's some interesting data there.
- In particular, we'll be interested in the global sales numbers (millions of units), which is the last number on each row/line. Notice that that number is given with 2 decimal places of precision, and that it's sometimes less than 1.
- As usual, we're interested in the most significant digit of each number. For a number like "23.74", we interested in the "2". For a number like "0.04", we're interested in the "4".
- Once more, create a histogram of the fractions of each of those 9 significant digits of all the video game sales figures.
While you're comtemplating why the universe seems to like "1" more than it likes "2", etc., package the 3 histograms onto a webpage (do put your name someplace) and upload the page and images to moe (that that the url works!) and put the url into the Comments-to-Teacher.
Benford's Law
Benford's Law and Populations